Further Information
Click on the following tabs for more information about Envista ARM Meteorological & Environmental Monitoring System:
- Microsoft
Windows Server 2000/2003
- Client-Server,
32 bit application
- SQL Server
2005, SQL Server 2008
or Oracle9i/10g DB
- Local and wide
area networking support
- Open system
architecture
- Multi-lingual
design
- Multi-document
interface
- Completely
menu-driven
- Collects data
from remote stations at scheduled times or upon request
- Manages up to
999 remote stations (9999 remote stations optional)
- Dynamic displays
- GIS/Map Viewer.
- Automatic data
backups
- Data analysis
and reporting
- Optional
equipment inventory and maintenance system
- Optional custom
reports
- Optional
Intranet or Internet web site
- Optional voice information system
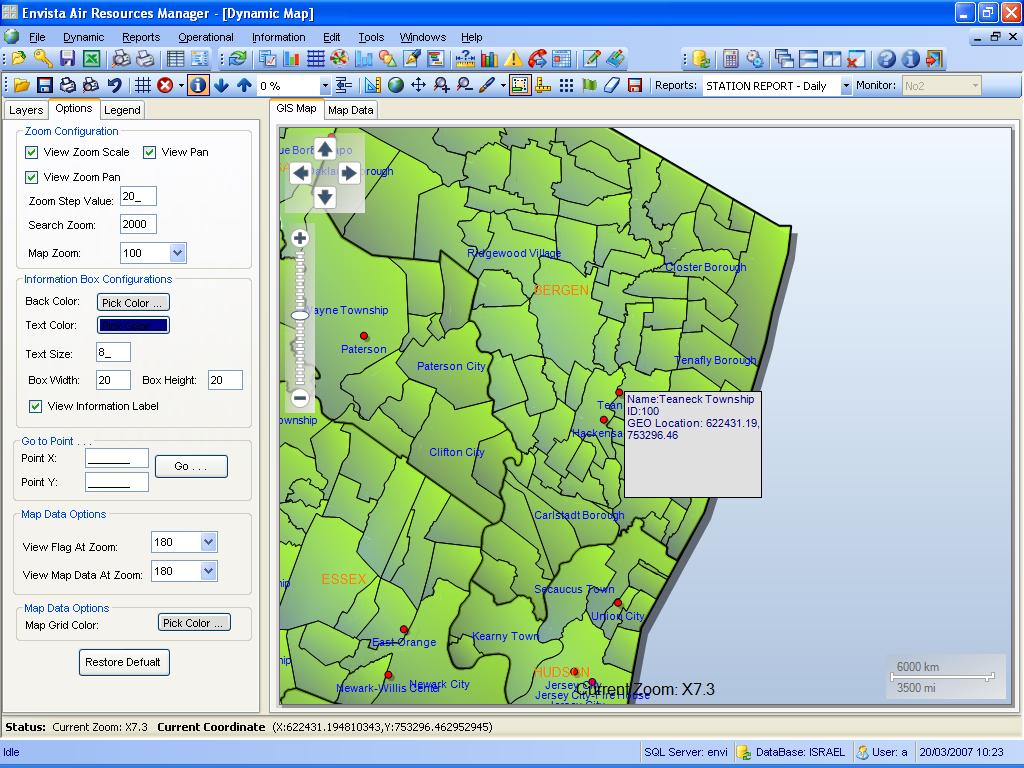
Envista ARM offers a variety of dynamic displays to support easy observation of system status and monitored values from the AQM stations. The following dynamic displays are available:
- Dynamic Tabular: Display current data for one or more AQM stations.
- Last Received: Date/Time of last data and calibration received from each AQM station
- Dynamic Map: Multi-location current data for a single parameter plus wind flags presented on a network area map.
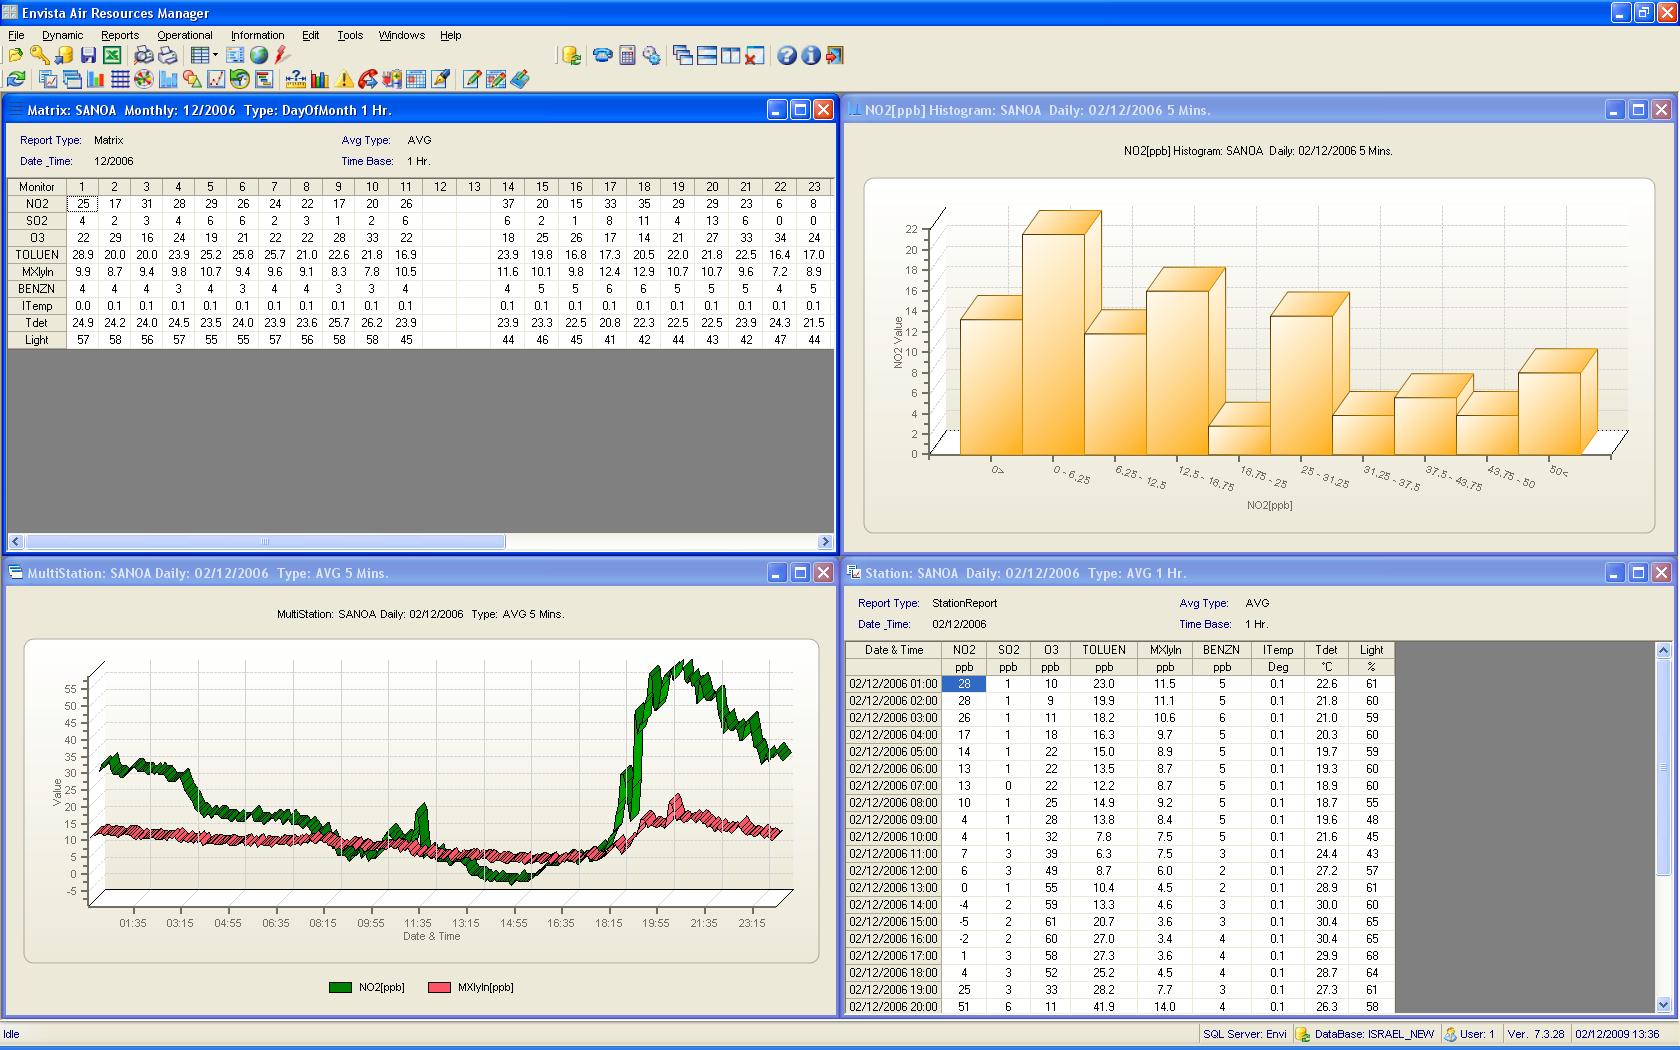
Many different reports are included with the Envista ARM data management system. These include both text and graphical reports. The following are some of the reports that are available:
- Station Report –Daily, Weekly, Monthly and Periodic tabular and graphic reports for selected monitors from selected AQM station.
- Group – Reflects group of monitors related to one/more stations as configured.
- Monthly Matrix - Monthly Summary by Hour and by Day.
- Wind Report – Tabular and graphic reports related to wind (direction and speed) and selected pollutant in several forms.
- Histogram - Frequency distribution.
- Index Report – Show air quality indexes of the pollution.
- Annual Reports – For yearly air monitoring reports.
- Edit History Reports – Tabular reflecting the changes in the data.
- Validation Report – Validations for stations and monitors (if were any) during selected period.
Each report is highly configurable. For example in the Station Report the user can select the following items:
- Averaging for 1 min, 2min, 5 min, 6 min, 10 min, 15 min, 30min, 1hr, 3hr, 6hr, 8hr, 12hr, or 24hr.
- Monitors included
- Table or graphical format.
- Filter criteria to restrict report output.
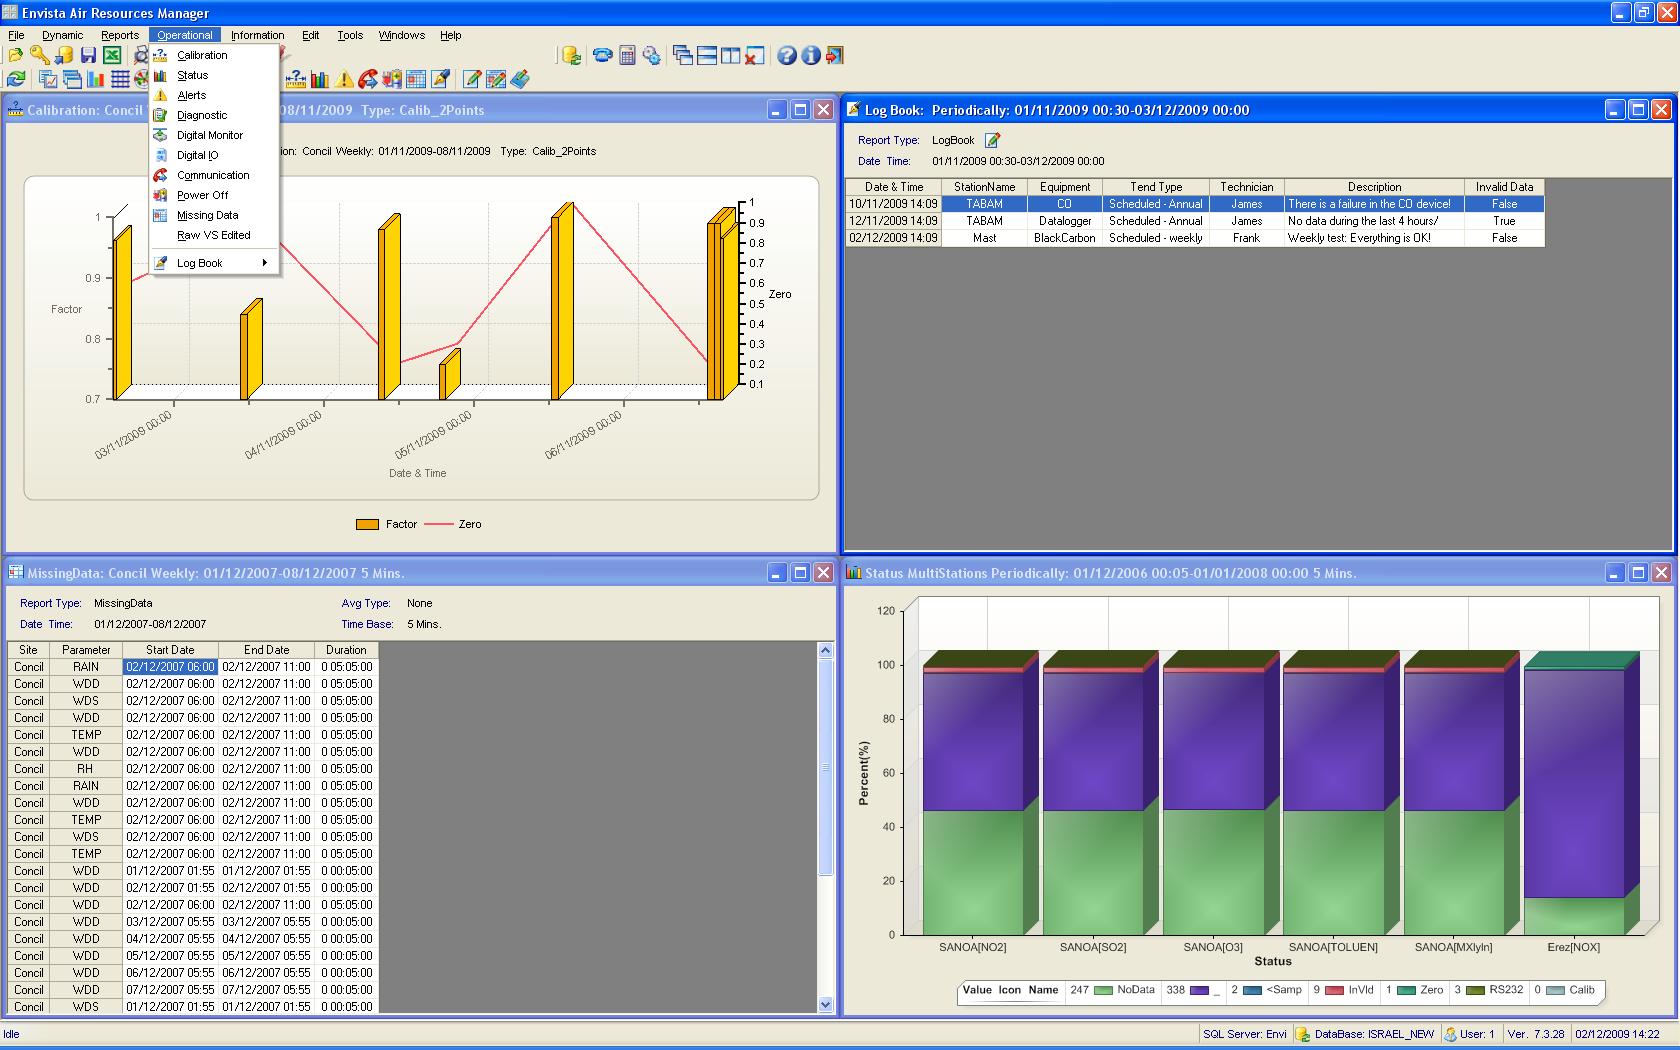
Operational reports offer information about the Envista ARM air monitoring stations. Some of the available Operational reports are:
- Calibration – 3 kinds of calibration reports.
- Status - Status information per selected monitors and air monitoring stations.
- Alerts - List of the alerts over selected period.
- Communication – Reports show the communication errors that have occurred during the selected period in the selected stations.
- Missing Data – Report that reflects the times that there was no data in the AQM station.
- Log Book – Let you, as a technician to produce a log report related to each AQM station.
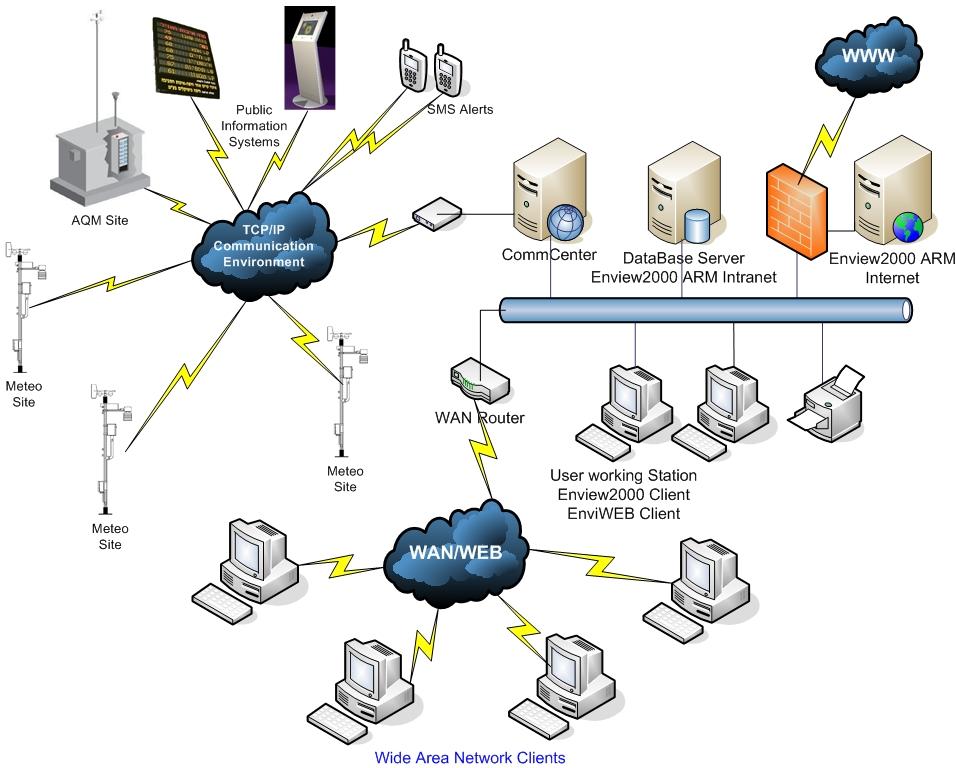
Typical Envista ARM air
monitoring system architecture is shown below. It
utilizes a server for the database, an application server for CommCenter
and public and intranet web sites, and AQM workstations
for other client program access.
Many other arrangements are possible including:
- Operation on a single PC
- Redundant CommCenter installation with failover
- Multiple CommCenter installations for load sharing
- Tiered data collection utilizing Regional CommCenter installations that collect data locally and then serve data to a single master CommCenter and database
- Redundant databases with automated failover